Leeds Beckett University - City Campus,
Woodhouse Lane,
LS1 3HE
Run question analysis on a test
Page last updated:
Item Analysis displays test performance and individual test question statistics. It helps you recognise questions that might be poor indicators of student performance.
You can use this information to improve questions in future tests or adjust credit on current attempts.
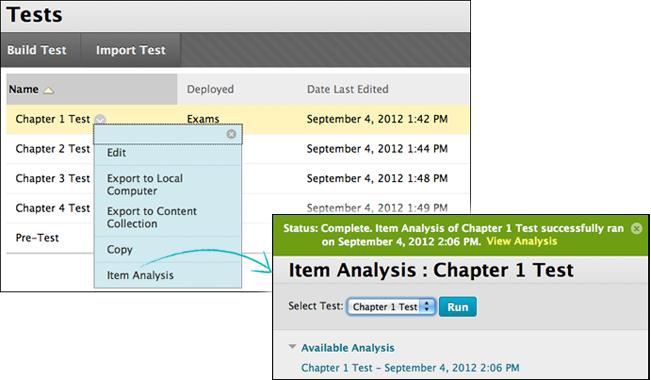
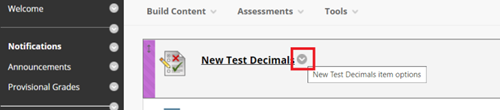
Instructors access Item Analysis by clicking the action link (down arrow) on one of the following:
- Test deployed in a content area.
- Deployed test listed on the Tests page (Tests, Surveys and Pools).
- Grade Centre column.
For best results, run item analyses on single attempt tests after all attempts have been submitted and all questions requiring manual review are marked. Interpret item analysis data with awareness that it's influenced by the number of test attempts and chance errors.
- A multiple choice question was flagged for review on the item analysis page. More Top 25% students chose answer B, but A was correct. You realise the correct answer was mistyped during question creation. Edit the question and it's automatically re-marked.
- In a multiple choice question, you find that nearly equal numbers of students chose A, B, and C. Examine answer choices to determine if they were too ambiguous, if the question was too difficult, or if the material was not covered in teaching.
- A question is flagged for review because it falls into the hard difficulty category. You examine it and find that it's a hard question, but you keep it in the test because it's necessary to test your module objectives.
You can run analysis on tests on the following:
- Single or Multiple attempts
- Question sets
- Random Blocks
- Auto-marked question types
- Questions that require manual marking
Note: For tests with manually marked questions that have not yet been reviewed, statistics are generated only for scored questions. After you manually mark questions, run the analysis again to update the statistics.
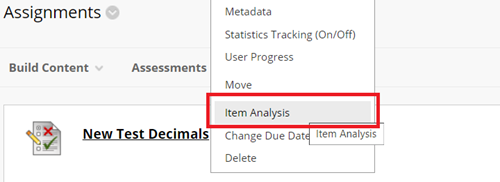
a. Find the test in your module and click the action link (down arrow) next to it.
b. Click Item Analysis.
c. In the Select Test drop-down, choose a test. Only deployed tests are listed.
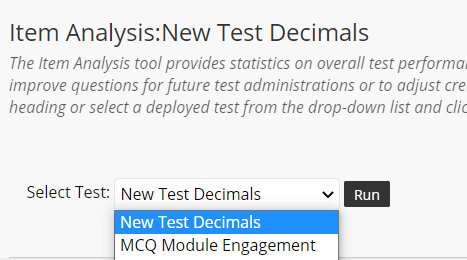
d. Click Run.
e. Expand the Available Analysis heading and click the name of the test.
a. The Test Summary at the top of the Item Analysis page provides data on the test as a whole.
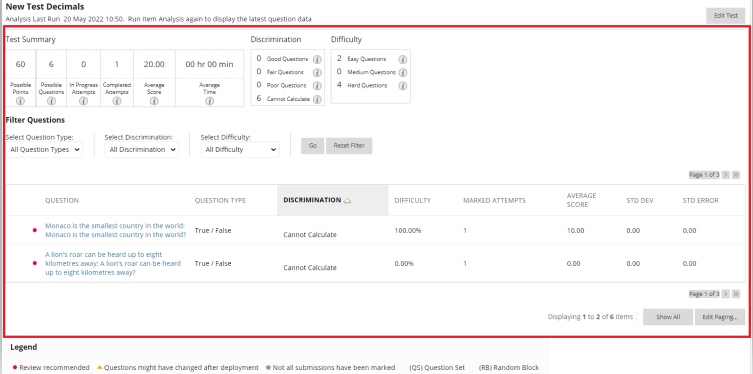
b. Edit Test provides access to the Test Canvas.
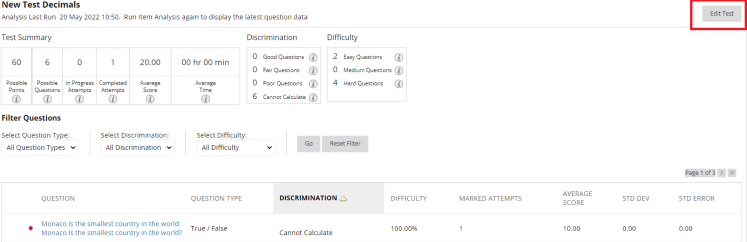
c. The Test Summary provides statistics on the test. You can find out more about them by clicking the tooltip info buttons (marked with an i).
This provides item analysis statistics for each test question. Questions recommended for your review are identified by red circles to the left hand side of the question so you can scan for questions that need revision.
In general, good questions have:
- Medium (30% to 80%) difficulty.
- Good or Fair (greater than 0.1) discrimination values.
Questions that are seen as not good questions and flagged by red circles generally due to being low quality or scored incorrectly. Typically they have:
- Easy ( > 80%) or Hard ( < 30%) difficulty.
- Poor ( < 0.1) discrimination values.
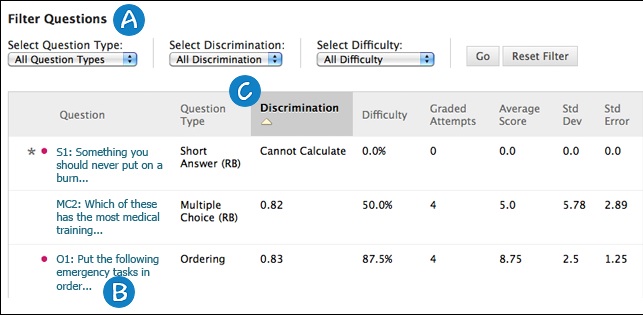
a. You can filter the question table by Question Type, Discrimination, and Difficulty.
b. Investigate a specific question by clicking its title and reviewing its Question Details.
c. Question statistics displayed in the table:
- Discrimination indicates how well a question differentiates between students who know the subject matter those who do not. A question is a good discriminator when students who answer the question correctly also do well on the test. Questions are flagged for review if their discrimination value is less than 0.1 or is negative.
- Difficulty shows the percentage of students who answered the question correctly. Difficulty values can range from 0% to 100%. A high percentage indicates an easy question. Easy (greater than 80%) or hard (less than 30%) questions are flagged for review.
- High difficulty values do not assure high levels of discrimination.
- Graded Attempts: number of questions for which marking is complete. Higher numbers mean more reliable statistics.
- Average Score denoted with an * indicates that some attempts are not marked, so the average score might change after all attempts are marked.
- Std Dev measures how far the scores deviate from the average score. If the scores are tightly grouped (most values close to the average) the standard deviation is small. If the scores are widely dispersed (values far from the average) the standard deviation is larger.
- Std Error is an estimate of variability in a student’s score due to chance. The smaller the standard error number, the more accurate the measurement provided by the test question.
To investigate a question that's flagged for review, access its Question Details:
a. Click a question title.
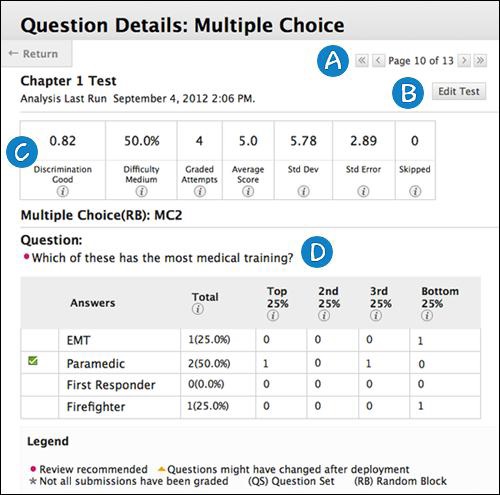
b. Use the arrows to navigate questions sequentially or skip to the first / last question.
c. Click Edit Test to access the Test Canvas.
d. The summary table question statistics:
- Discrimination, Difficulty, Graded Attempts, Average Score, Std Dev, Std Error (described in section 4 above).
- Skipped: Number of students who skipped the question.
e. The information varies depending on the question type:
| Type of information | Question type |
|
Number of students who selected each answer choice and distribution of those answers among the class quartiles. |
Multiple Choice Multiple Answer True / False Either / Or Opinion Scale / Likert |
| Number of students who selected each answer choice. | Matching Ordering Fill in Multiple Blanks |
| Number of students who got the question correct, incorrect, or skipped it. | Calculated Formula Calculated Numeric Fill in the Blank Hot Spot Quiz Bowl |
| Question text only. | Essay File Response Short Answer Jumbled Sentence (also includes answers students chose from) |
The distribution of answers among the class quartiles is included for Multiple Choice, Multiple Answer, True / False, Either / Or, and Opinion Scale / Likert question types. It shows you the types of student who selected correct or incorrect answers.
- Top 25%: Number of students with total test scores in the top quarter of the class who selected the answer option.
- 2nd 25%: Number of students with total test scores in the second quarter of the class who selected the answer option.
- 3rd 25%: Number of students with total test scores in the third quarter of the class who selected the answer option.
- Bottom 25%: Number of students with total test scores in the bottom quarter of the class who selected the answer option.
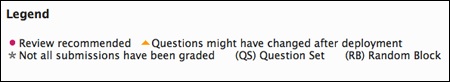
Symbols appear next to questions to alert you to possible issues:
Review recommended: Triggered when discrimination values are less than 0.1 or when difficulty values are either greater than 80% (too easy) or less than 30% (too hard). Review the question to see if it needs revision.
- Question might have changed after deployment: A part of the question changed since the test was deployed. This could mean question data might not be reliable. Attempts submitted after the question changed may have benefited from the change.
- Not all submissions have been graded: Appears for questions that require manual marking e.g. essay questions. If a test contains an essay question with 50 student attempts, this indicator shows until someone marks all 50 attempts. The item analysis tool only uses attempts that have been marked at the time you run the report.
- (QS) and (RB): The question came from a Question Set or Random Block. With random question delivery, it's possible some questions get more attempts than others.
Item Analysis handles multiple attempts, overrides etc. in the following ways:
- If students take a test multiple times, the last submitted attempt is analysed. E.g. a test allows three attempts and Kelly has completed two attempts with a third attempt in progress. Her third attempt counts toward her In Progress Attempts and no previous attempts are included in the current item analysis data. When she submits the third attempt, subsequent item analyses will include it.
- Grade Centre overrides don't have an impact on item analysis.
- Manually marked answers, question text changes, correct answer choice, partial credit or points don't auto-update the analysis. Run it again to see changes reflected in data.