
Leeds Beckett University - City Campus,
Woodhouse Lane,
LS1 3HE
ANALYTICS PART TWO | ULTRA
![]()
Page last updated:
Analytics in Ultra
Introduction to Analytics
This is a guide to the Analytics function in Ultra which has partly been described in the guide Progress Tracking and Analytics on teachlearn which will be linked to below.
This guide will go into more detail on how the Analytics function may be a useful resource on how the module has been accessed detailing the student activity within it. There is a tie-in also with The Grade Centre which generates information that can be seen here as well as in the Grade Centre.
Included in Analytics is the Question analysis function that produces statistics on test questions. For example, it will flag up a test question answered incorrectly by a majority of students. This could aid both student and/or tutor. It could demonstrate a gap in the student's knowledge and/or a possibility that the question is unclear and needs rephrasing by the tutor.
Accessing Analytics
If you click on the Analytics tab as shown below, you will see the four tab menu choices available under it. This is the left hand side of the screen.
Please note of the last two tab menu choices, SCORM reports are not detailed here as there are few SCORM courses included in modules at the University. Module Reports are also not detailed here, as they are based on the Goals function in Ultra which is not added for Ultra at the University.
If we look at the first tab Module Activity we can see it lists the Overall mark set and Missed Due Dates for individual students. As mentioned in the Introduction to Analytics above, the Overall mark is set and generated from the Grade centre. Please see the guide on the Grade Centre here

Below shows the right-hand side of the above screen which lists the other categories of student's activity in the module: Hours in Module and Days Since Last Access:
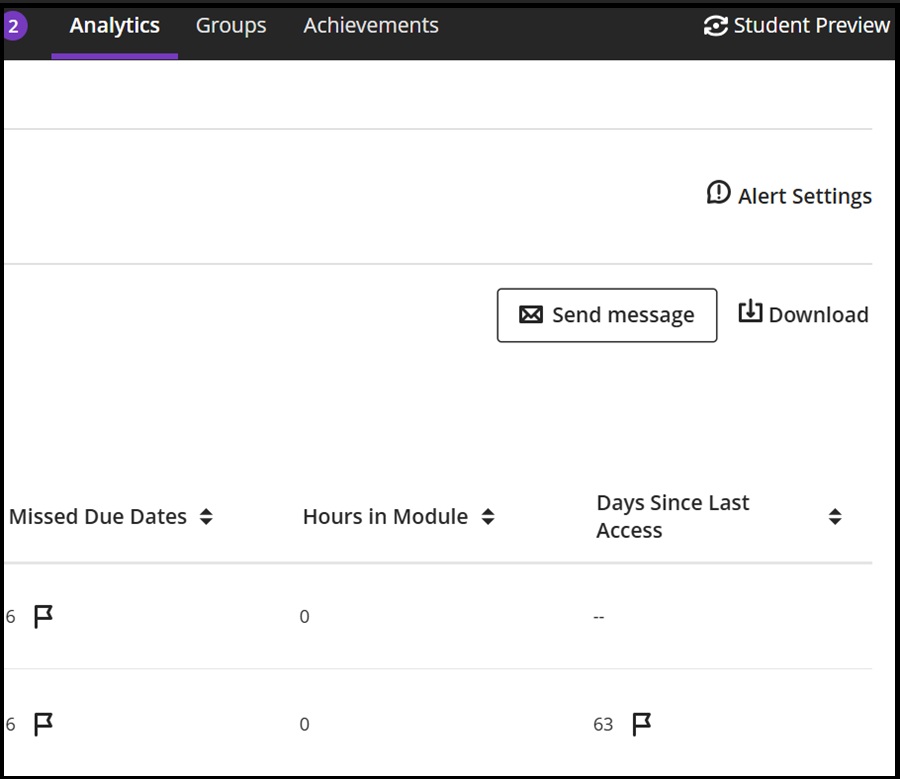
Alert Settings
As seen in the above screen shot, Alert Settings identifies students from the first two items in the Module Activity tab (i.e. Overall mark set and Missed Due Dates) and how to set it is described in the Progress Tracking and Analytics guide on teachlearn here
It ties in with the Filter Alerts pull-down menu which shows students flagged on the settings entered on student performance levels:

The next two screen shots show the Students with alerts option chosen and the left and right side of the screen with their corresponding flagged alerts:


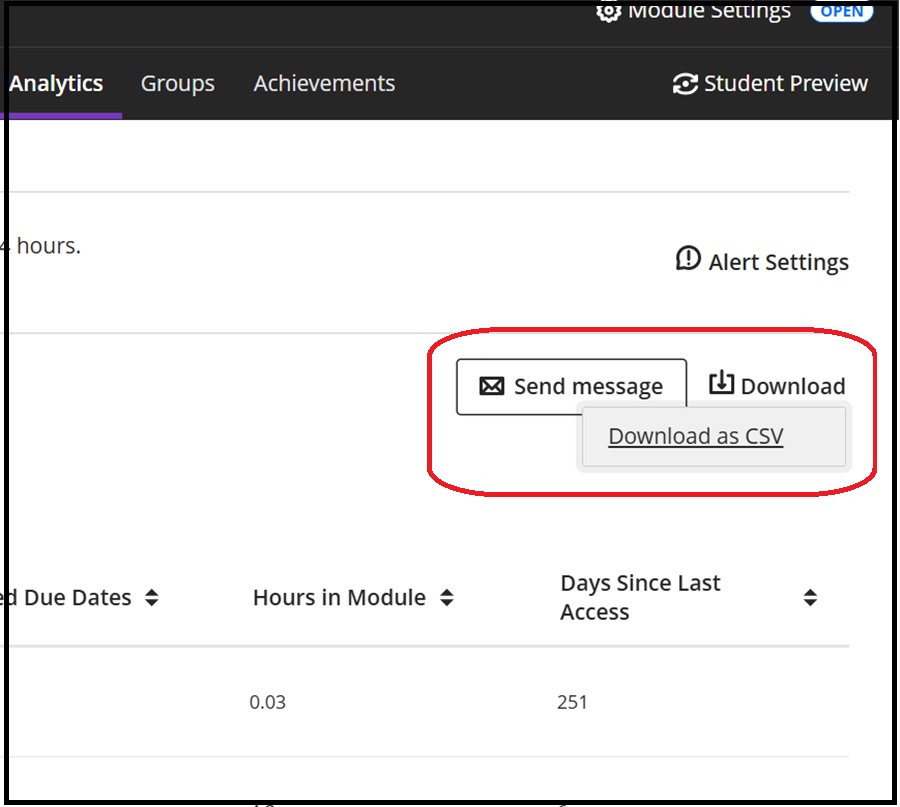
Send Message and Download
Send Message acts in the same way as in the Student tab of the Grade centre although unlike that location, it appears at the right-hand side of the screen and not against an individual student listed. Clicking Send Message here allows you to contact individual students, groups etc.
Download enables you to save the Module Activity information as a .CSV (spreadsheet format) file for offline use and analysis if required.
Student info link
Clicking the student name link in the Module activity tab will show the same screen as the Students tab in Grade Centre - please see the second screen shot:

Please note the Progress tab shown below is detailed in the Progress Tracking and analytics teachlearn guide here

Institution page Marks menu
On the institution page and in the Marks menu, you can access Module Activity Related to Marks directly. Select the module required,

and to the right of the screen click the pie chart icon which will open this up:

This method will bring you specifically to the page headed Module Activity Related to Marks and will not show the other tabs in the Analytics tab menu (e.g. Question Analysis etc.).
Clicking the student name link will also show the same as detailed in the above Student info link (Module activity tab):

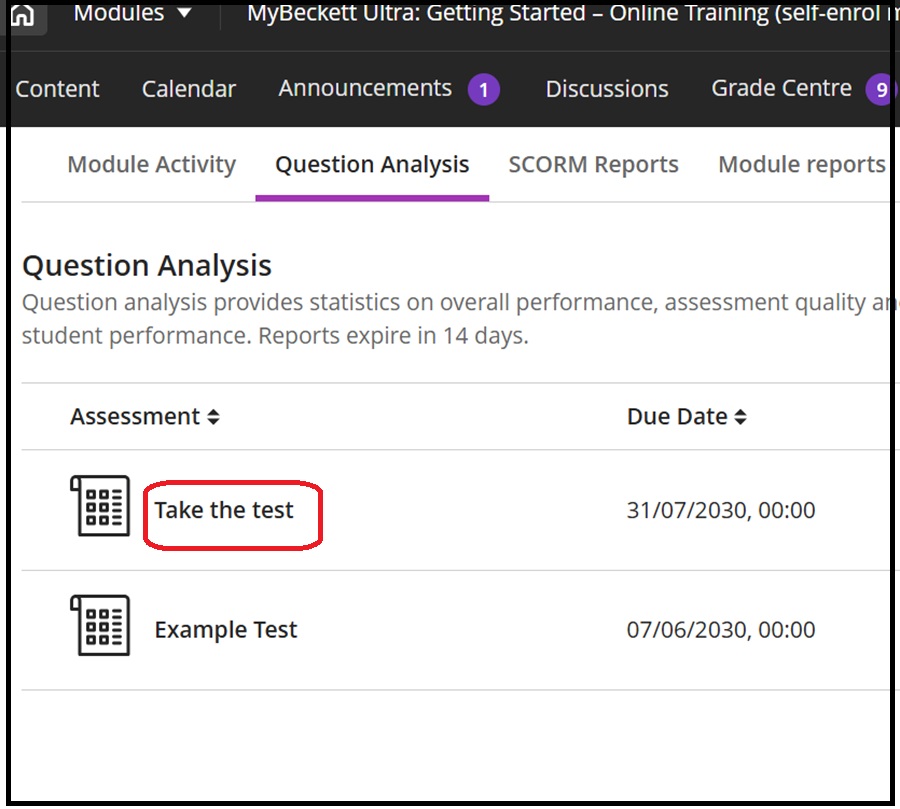
Question Analysis
As the note under the tab heading describes, this function allows you to run a report on test questions which will produce statistics on them as described. Click the name of the test link you require and see the fourth screen shot down for the result of accessing it this way:
There are two other ways of accessing Question Analysis: one by clicking on the three dots menu on the right-hand side of the particular test on either the Content area or the Grade Centre (Markable items tab):


If you have clicked on the test link in the Question Analysis tab, to the right of the question click Run Report to generate a report on the questions in the test:
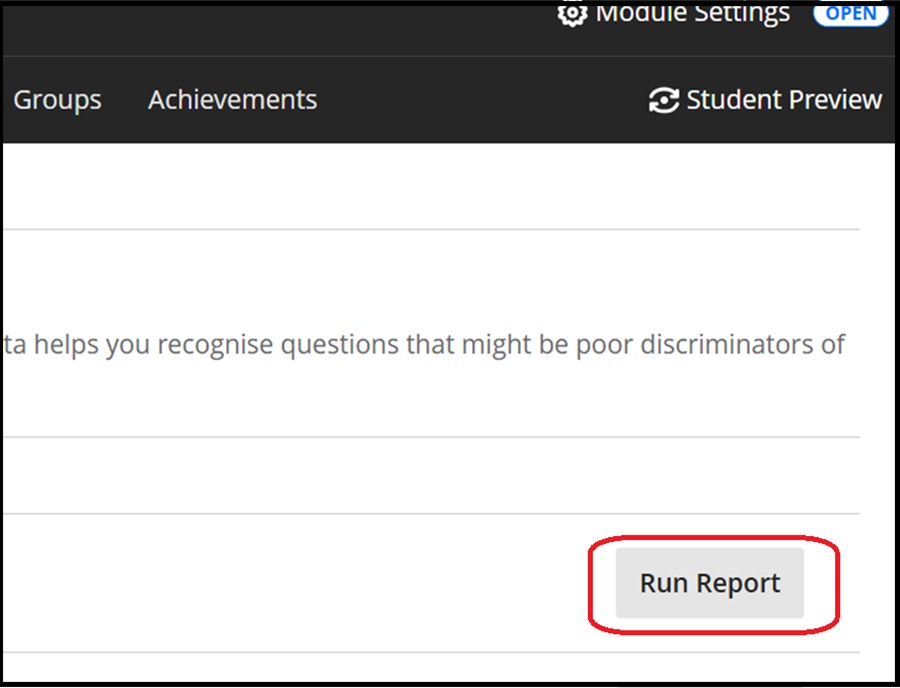
A message notifies of the report progress and you will also receive an email confirming the report:

Once the email has been received to confirm the report is generated click the test name link again (as above) to view the report.
The next two screen shots show the questions analysed on how they test subject knowledge (Discrimination) and rate the questions on difficulty etc. (left hand side shown first):

A 'good' question has a discrimination value of greater than 0.3 a fair one between 0.1 and 0.3 etc. If its difficulty percentage is between the limits of 30 and 80 this is also classed as a good question (being of Medium difficulty). Please see the screen shots below to see how this is flagged up:

The next two screen shots are the bottom half of the screen (left and right) with the question text and detail the analysis of individual questions. The Needs Review message flagged up against a question is determined either by its discrimination value if it is less than 0.1 or its difficulty rating (either too easy or too hard as shown above.


If you would like to know how discrimination values are calculated, please see Blackboard's page on Question Analysis here
Download test questions
You can download test questions from the report on the right-hand side of the screen. Above Marked Attempts, click the download icon: